
Introduction
Subscription based businesses are super popular and Danny realised that there was a large gap in the market - he wanted to create a new streaming service that only had food related content - something like Netflix but with only cooking shows!
Danny finds a few smart friends to launch his new startup Foodie-Fi in 2020 and started selling monthly and annual subscriptions, giving their customers unlimited on-demand access to exclusive food videos from around the world!
Danny created Foodie-Fi with a data driven mindset and wanted to ensure all future investment decisions and new features were decided using data. This case study focuses on using subscription style digital data to answer important business questions.
Available Data
Danny has shared the data design for Foodie-Fi and also short descriptions on each of the database tables - our case study focuses on only 2 tables but there will be a challenge to create a new table for the Foodie-Fi team.
All datasets exist within the foodie_fi database schema - be sure to include this reference within your SQL scripts as you start exploring the data and answering the case study questions.
Entity Relationship Diagram
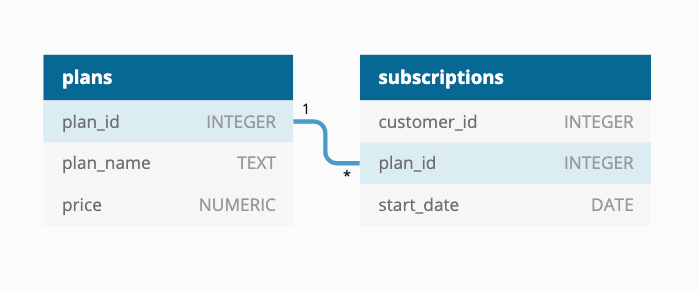
Table 1: plans
Customers can choose which plans to join Foodie-Fi when they first sign up.
Basic plan customers have limited access and can only stream their videos and is only available monthly at $9.90
Pro plan customers have no watch time limits and are able to download videos for offline viewing. Pro plans start at $19.90 a month or $199 for an annual subscription.
Customers can sign up to an initial 7 day free trial will automatically continue with the pro monthly subscription plan unless they cancel, downgrade to basic or upgrade to an annual pro plan at any point during the trial.
When customers cancel their Foodie-Fi service - they will have a churn plan record with a null price but their plan will continue until the end of the billing period.
| plan_id | plan_name | price |
|---|---|---|
| 0 | trial | 0 |
| 1 | basic monthly | 9.90 |
| 2 | pro monthly | 19.90 |
| 3 | pro annual | 199 |
| 4 | churn | null |
Table 2: subscriptions
Customer subscriptions show the exact date where their specific plan_id starts.
If customers downgrade from a pro plan or cancel their subscription - the higher plan will remain in place until the period is over - the start_date in the subscriptions table will reflect the date that the actual plan changes.
When customers upgrade their account from a basic plan to a pro or annual pro plan - the higher plan will take effect straightaway.
When customers churn - they will keep their access until the end of their current billing period but the start_date will be technically the day they decided to cancel their service.
| customer_id | plan_id | start_date |
|---|---|---|
| 1 | 0 | 2020-08-01 |
| 1 | 1 | 2020-08-08 |
| 2 | 0 | 2020-09-20 |
| 2 | 3 | 2020-09-27 |
| 11 | 0 | 2020-11-19 |
| 11 | 4 | 2020-11-26 |
| 13 | 0 | 2020-12-15 |
| 13 | 1 | 2020-12-22 |
| 13 | 2 | 2021-03-29 |
| 15 | 0 | 2020-03-17 |
| 15 | 2 | 2020-03-24 |
| 15 | 4 | 2020-04-29 |
| 16 | 0 | 2020-05-31 |
| 16 | 1 | 2020-06-07 |
| 16 | 3 | 2020-10-21 |
| 18 | 0 | 2020-07-06 |
| 18 | 2 | 2020-07-13 |
| 19 | 0 | 2020-06-22 |
| 19 | 2 | 2020-06-29 |
| 19 | 3 | 2020-08-29 |
Interactive SQL Instance
You can use the embedded DB Fiddle below to easily access these example datasets - this interactive session has everything you need to start solving these questions using SQL.
You can click on the Edit on DB Fiddle link on the top right hand corner of the embedded session below and it will take you to a fully functional SQL editor where you can write your own queries to analyse the data.
You can feel free to choose any SQL dialect you’d like to use, the existing Fiddle is using PostgreSQL 13 as default.
Serious SQL students will have access to the same relevant schema SQL and example solutions which they can use with their Docker setup from within the course player!
Case Study Questions
This case study is split into an initial data understanding question before diving straight into data analysis questions before finishing with 1 single extension challenge.
A. Customer Journey
Based off the 8 sample customers provided in the sample from the subscriptions table, write a brief description about each customer’s onboarding journey.
Try to keep it as short as possible - you may also want to run some sort of join to make your explanations a bit easier!
B. Data Analysis Questions
- How many customers has Foodie-Fi ever had?
- What is the monthly distribution of
trialplanstart_datevalues for our dataset - use the start of the month as the group by value - What plan
start_datevalues occur after the year 2020 for our dataset? Show the breakdown by count of events for eachplan_name - What is the customer count and percentage of customers who have churned rounded to 1 decimal place?
- How many customers have churned straight after their initial free trial - what percentage is this rounded to the nearest whole number?
- What is the number and percentage of customer plans after their initial free trial?
- What is the customer count and percentage breakdown of all 5
plan_namevalues at2020-12-31? - How many customers have upgraded to an annual plan in 2020?
- How many days on average does it take for a customer to an annual plan from the day they join Foodie-Fi?
- Can you further breakdown this average value into 30 day periods (i.e. 0-30 days, 31-60 days etc)
- How many customers downgraded from a pro monthly to a basic monthly plan in 2020?
C. Challenge Payment Question
The Foodie-Fi team wants you to create a new payments table for the year 2020 that includes amounts paid by each customer in the subscriptions table with the following requirements:
- monthly payments always occur on the same day of month as the original
start_dateof any monthly paid plan - upgrades from basic to monthly or pro plans are reduced by the current paid amount in that month and start immediately
- upgrades from pro monthly to pro annual are paid at the end of the current billing period and also starts at the end of the month period
- once a customer churns they will no longer make payments
Example outputs for this table might look like the following:
| customer_id | plan_id | plan_name | payment_date | amount | payment_order |
|---|---|---|---|---|---|
| 1 | 1 | basic monthly | 2020-08-08 | 9.90 | 1 |
| 1 | 1 | basic monthly | 2020-09-08 | 9.90 | 2 |
| 1 | 1 | basic monthly | 2020-10-08 | 9.90 | 3 |
| 1 | 1 | basic monthly | 2020-11-08 | 9.90 | 4 |
| 1 | 1 | basic monthly | 2020-12-08 | 9.90 | 5 |
| 2 | 3 | pro annual | 2020-09-27 | 199.00 | 1 |
| 13 | 1 | basic monthly | 2020-12-22 | 9.90 | 1 |
| 15 | 2 | pro monthly | 2020-03-24 | 19.90 | 1 |
| 15 | 2 | pro monthly | 2020-04-24 | 19.90 | 2 |
| 16 | 1 | basic monthly | 2020-06-07 | 9.90 | 1 |
| 16 | 1 | basic monthly | 2020-07-07 | 9.90 | 2 |
| 16 | 1 | basic monthly | 2020-08-07 | 9.90 | 3 |
| 16 | 1 | basic monthly | 2020-09-07 | 9.90 | 4 |
| 16 | 1 | basic monthly | 2020-10-07 | 9.90 | 5 |
| 16 | 3 | pro annual | 2020-10-21 | 189.10 | 6 |
| 18 | 2 | pro monthly | 2020-07-13 | 19.90 | 1 |
| 18 | 2 | pro monthly | 2020-08-13 | 19.90 | 2 |
| 18 | 2 | pro monthly | 2020-09-13 | 19.90 | 3 |
| 18 | 2 | pro monthly | 2020-10-13 | 19.90 | 4 |
| 18 | 2 | pro monthly | 2020-11-13 | 19.90 | 5 |
| 18 | 2 | pro monthly | 2020-12-13 | 19.90 | 6 |
| 19 | 2 | pro monthly | 2020-06-29 | 19.90 | 1 |
| 19 | 2 | pro monthly | 2020-07-29 | 19.90 | 2 |
| 19 | 3 | pro annual | 2020-08-29 | 199.00 | 3 |
D. Outside The Box Questions
The following are open ended questions which might be asked during a technical interview for this case study - there are no right or wrong answers, but answers that make sense from both a technical and a business perspective make an amazing impression!
- How would you calculate the rate of growth for Foodie-Fi?
- What key metrics would you recommend Foodie-Fi management to track over time to assess performance of their overall business?
- What are some key customer journeys or experiences that you would analyse further to improve customer retention?
- If the Foodie-Fi team were to create an exit survey shown to customers who wish to cancel their subscription, what questions would you include in the survey?
- What business levers could the Foodie-Fi team use to reduce the customer churn rate? How would you validate the effectiveness of your ideas?
Conclusion
This case study should reflect realistic questions we usually focus on for all product related analytics requests in a wide variety of industries, especially in the digital space!
Ready for the next 8 Week SQL challenge case study? Click on the banner below to get started with case study #4!
Official Solutions
If you’d like to see the official code solutions and explanations for this case study and a whole lot more, please consider joining me for the Serious SQL course - you’ll get access to all course materials and I’m on hand to answer all of your additional SQL questions directly!
Serious SQL is priced at $49USD and $29 for students and includes access to all written course content, community events as well as live and recorded SQL training videos!
Please send an email to support@datawithdanny.com from your educational email or include your enrolment details or student identification for a speedy response!
Community Solutions
This section will be updated in the future with any community member solutions with a link to their respective GitHub repos!
Final Thoughts
The 8 Week SQL Challenge is proudly brought to you by me - Danny Ma and the Data With Danny virtual data apprenticeship program.
Students or anyone undertaking further studies are eligible for a $20USD student discount off the price of Serious SQL please send an email to support@datawithdanny.com from your education email or include information about your enrolment for a fast response!
We have a large student community active on the official DWD Discord server with regular live events, trainings and workshops available to all Data With Danny students, plus early discounted access to all future paid courses.
There are also opportunities for 1:1 mentoring, resume reviews, interview training and more from myself or others in the DWD Mentor Team.
From your friendly data mentor, Danny :)
All 8 Week SQL Challenge Case Studies
All of the 8 Week SQL Challenge case studies can be found below: